Last week, the U.S. Supreme Court upheld a broader definition of what qualifies as racial discrimination under the Fair Housing Act of 1968 to include not only overt discrimination, but also policies that may seem fair on the surface, yet nevertheless adversely affect minorities.
The court ruled 5-4 in favor of a nonprofit group, which had argued that a Texas agency’s tax incentives for providing low-income housing were discriminatory because they caused minorities to be segregated to high-poverty areas – areas with worse schools, higher mortality rates and fewer opportunities overall.
Income segregation has increased over the past three decades in 27 of the largest 30 metropolitan areas across the U.S., according to a 2012 Pew Research Center report. In Dallas and many of the other metro areas we mapped, there were clear divisions between low-income neighborhoods and middle- and upper-income areas, as well as divisions along racial lines.
Our analysis found that, in the Dallas-Fort Worth-Arlington and Houston metros, 37% of low-income households (those that take in less than 67% of the metro area’s median annual household income, for example less than $38,000 in Dallas) are located in census tracts in which at least half of households are low-income. Residential concentration among upper-income households (defined as making at least 200% of the metro area’s median household income, for example at least $113,000 in Dallas) is also high in Texas. Houston and Dallas topped the charts among the 10 largest metropolitan areas, with 24% and 23%, respectively, of upper-income households lying in census tracts that were at least half upper-income.
Overall, these cities (along with the San Antonio metro area) had the highest Residential Income Segregation Index (RISI) scores among the country’s largest metropolitan areas in 2010; Dallas scored 60 points on our 200-point scale, where 200 signifies complete segregation by income. Meanwhile, the median RISI score for America’s top 10 metropolitan areas was 50, and Boston scored only a 36.
However, our 2012 report also found that residential segregation by income is still less prevalent than segregation by race, despite the fact that black-white segregation has been falling for decades nationally.
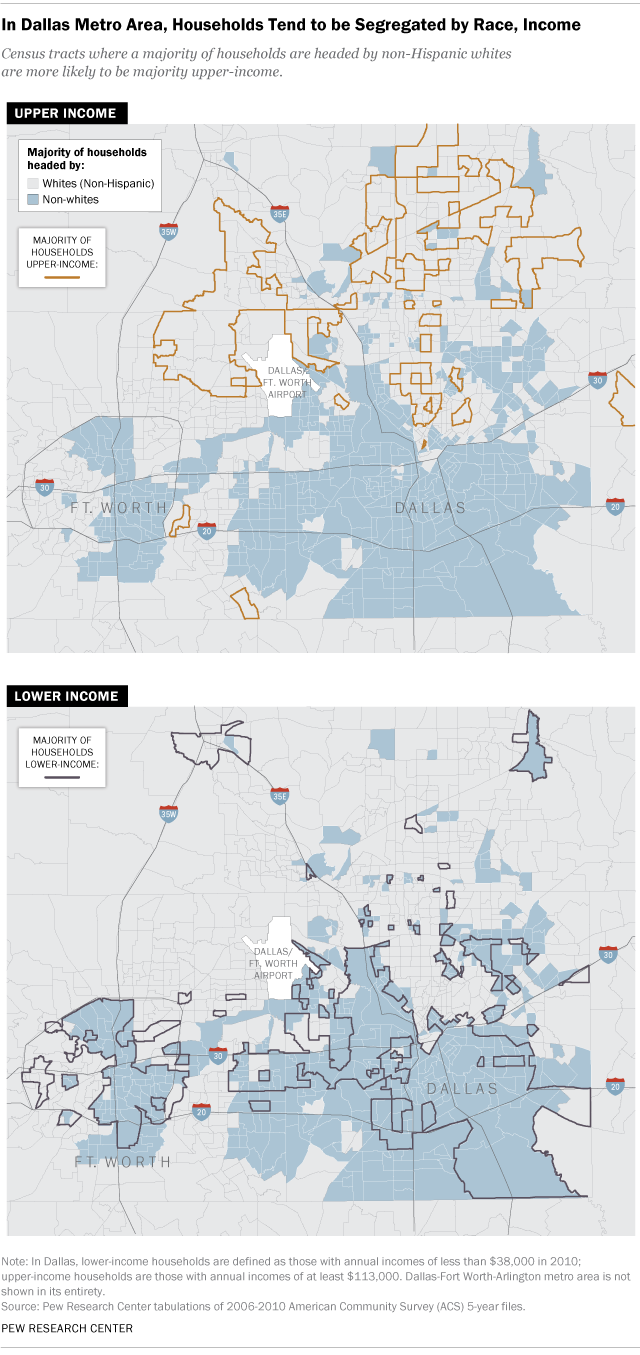
We mapped the Dallas metropolitan area by race of the head of household and by household income using data from the Census Bureau’s American Community Survey five-year estimates, centered on 2008 – the year the Supreme Court case on housing discrimination was filed. Census tracts with more than 50% of households headed by non-Hispanics whites were considered majority white, while all others were considered majority non-white.
Looking at the income and race maps shows a great deal of overlap between areas that are predominantly low-income and areas that are predominantly non-white in Dallas. There are 1,311 populated census tracts in the Dallas metropolitan area, and 19% of those are predominantly minority and majority low-income. Most of these are located in the southern part of the city of Dallas, separated from wealthier areas by Interstate 30, or in downtown Fort Worth.
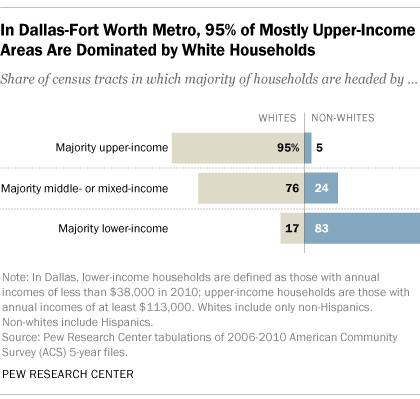
Of the 306 majority lower-income census tracts in the Dallas-Fort Worth area, 83% are predominantly non-white. Meanwhile, 95% of the 108 majority upper-income tracts are predominantly non-Hispanic white. Majority middle- and mixed-income tracts that are predominantly non-Hispanic white account for 52% of the Dallas metropolitan tracts, located mostly in suburban areas.